The South Kingstown RI Real Estate Market Report is a monthly statement of the average sales price for and number of 2 BR, 3 BR and 4 BR homes sold, the total number of sales, the number of active homes for sale and the average listing price of South Kingstown homes for sale.
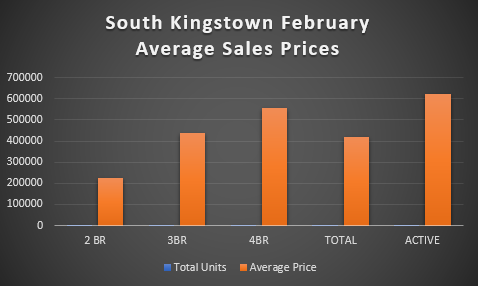
| FEBRUARY | 2 BR | 3BR | 4BR | TOTAL | ACTIVE |
| Total Units | 11 | 22 | 12 | 45 | 80 |
| Average Price | 223012 | 438499 | 558293 | 417770 | 622783 |
| YTD | 2 BR | 3BR | 4BR | TOTAL | |
| Total Units | 16 | 31 | 17 | 64 |
No comments:
Post a Comment